Dark Energy Surveys
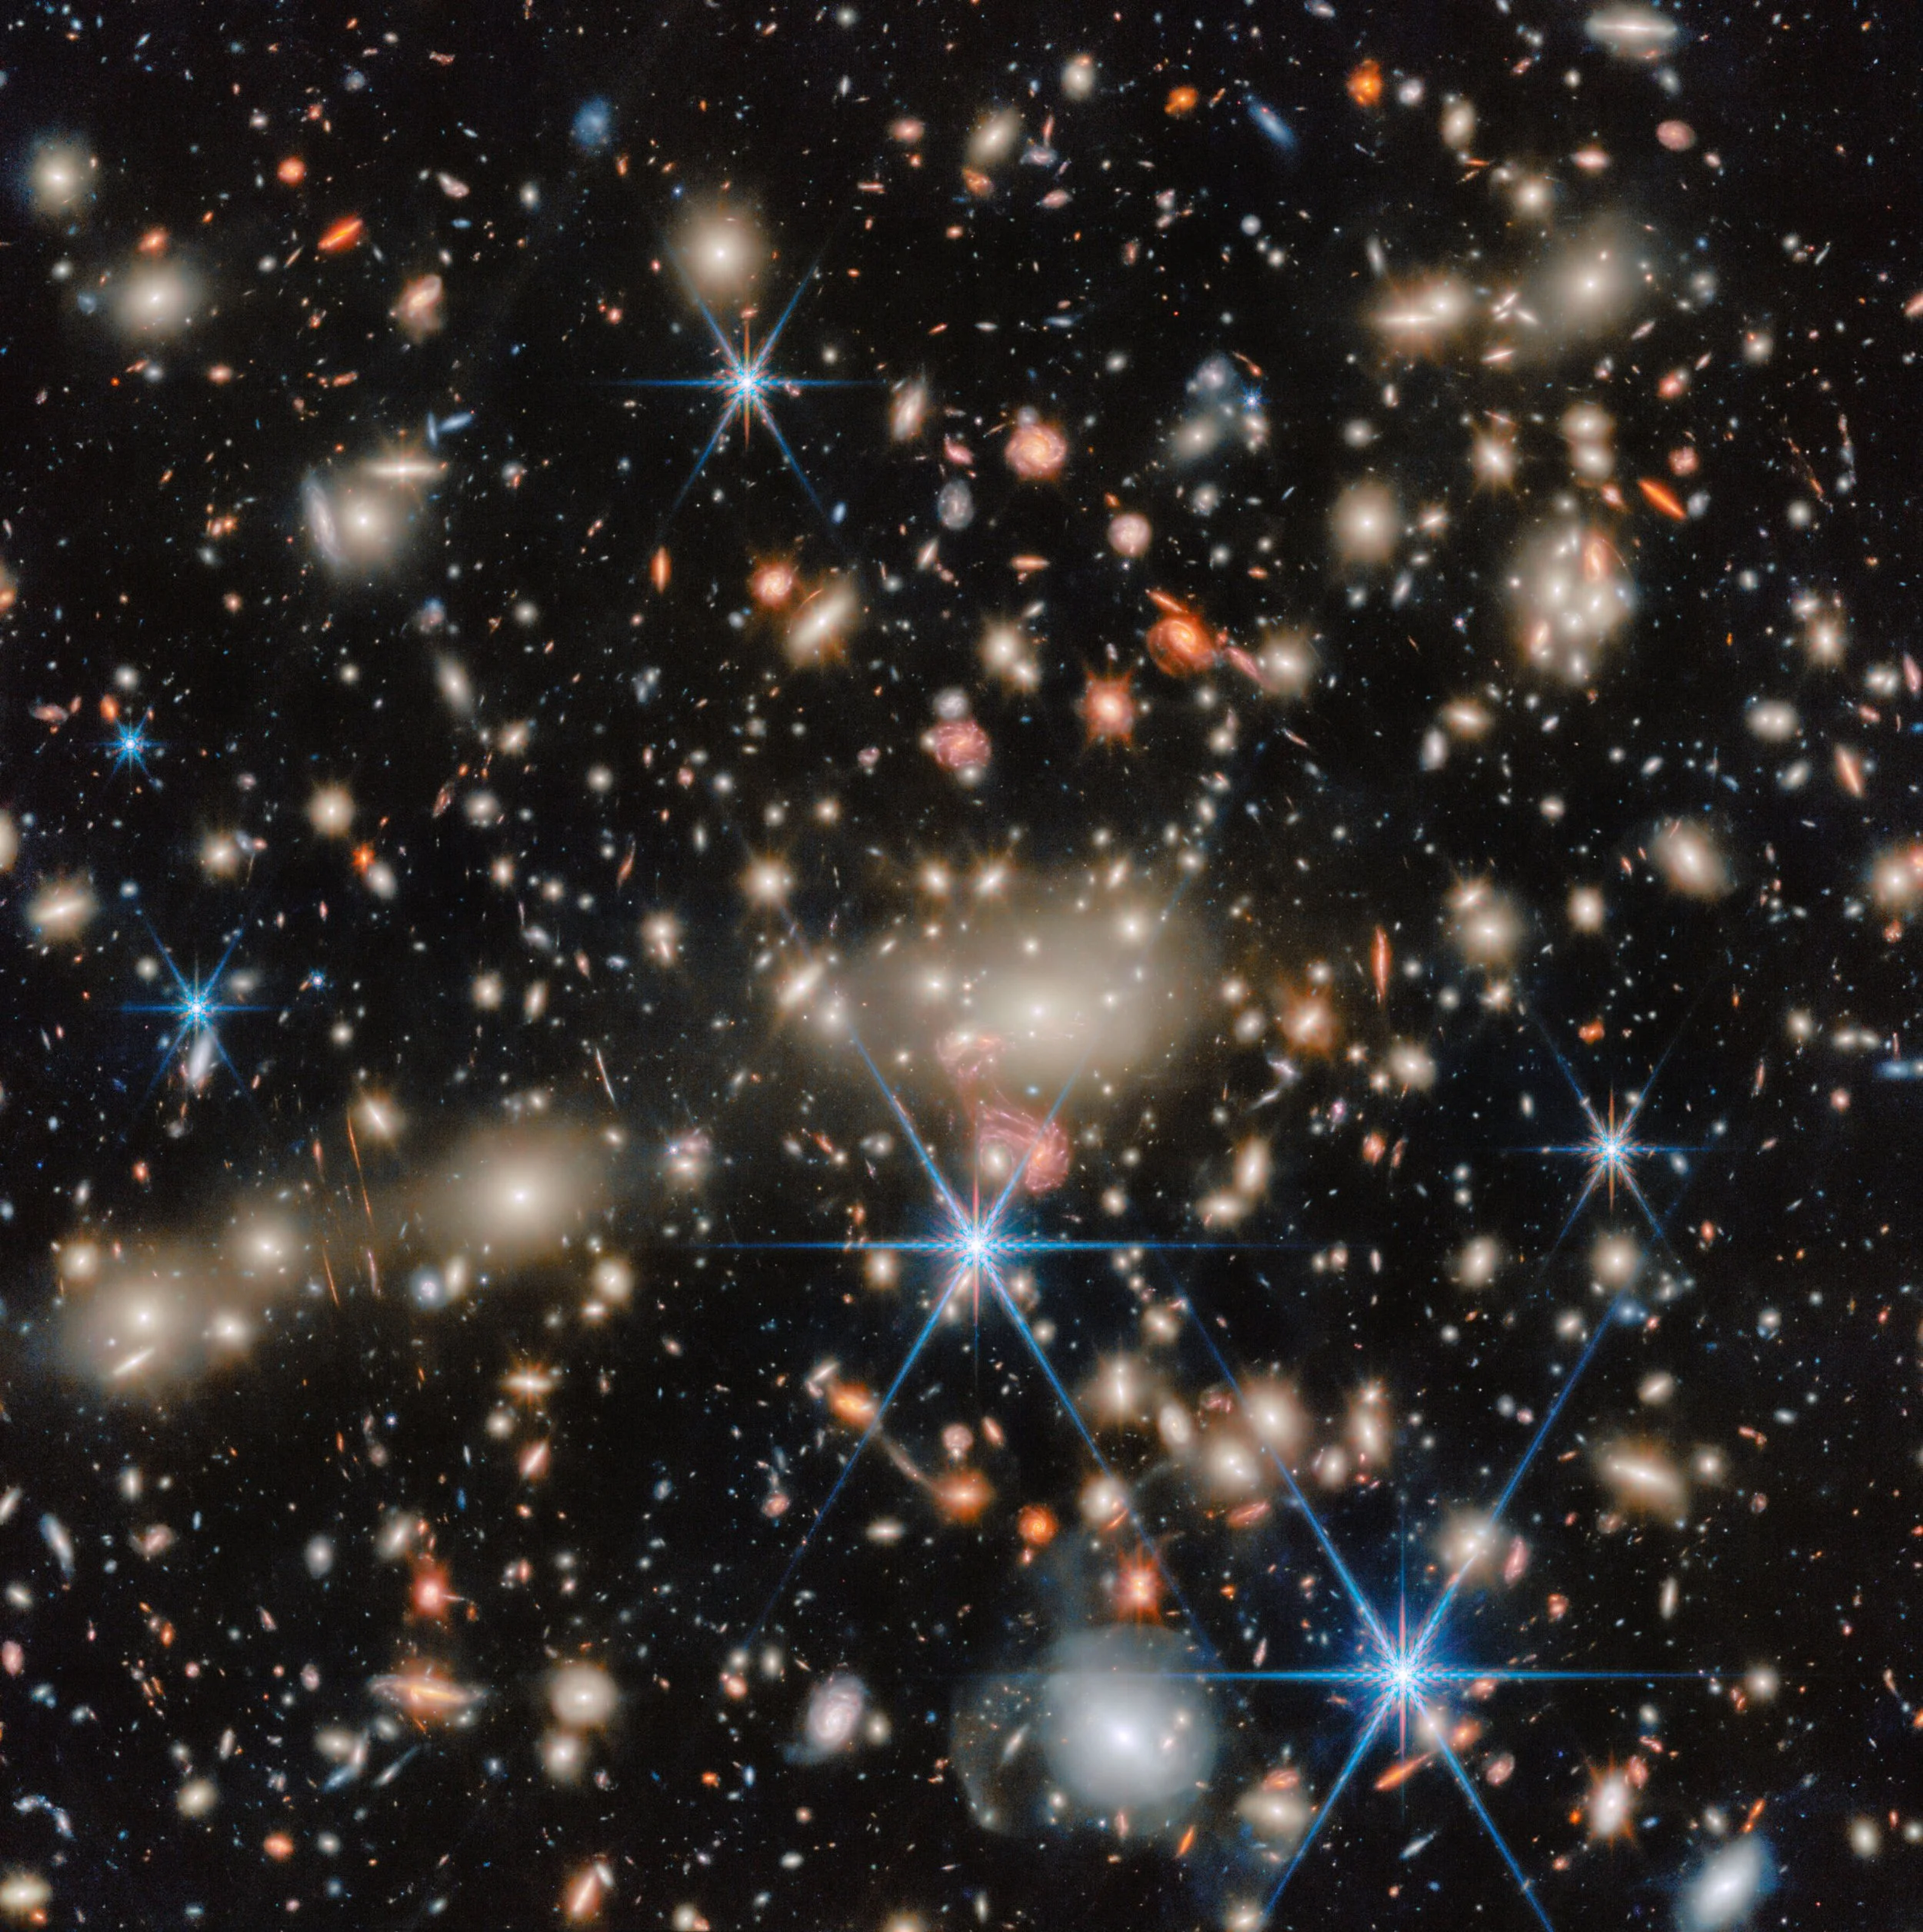
James Webb Space Telescope Picture of the Month credit: European Space Agency) Galaxy Cluster MACS J1149.5+2223 that was obtained by the CANUCS survey led by DAO Astronomer Chris Willott
In recent years, astronomers have begun to amass huge amounts of data, an amount some could even describe as "oodles." A recent example has been the Dark Energy Survey, where about 5000 square degrees of the southern sky was observed between 2013 and 2019 using the 4 m Victor Blanco telescope at the Cerro Tololo Interamerican Observatory in Chile. The Survey used the Dark Energy Camera (DECam), a 507 megapixel camera, to image 669 million galaxies over 758 nights. The idea here was to provide strong statistical evidence for how the universe is evolving over time, due to the influence of dark energy, the mysterious substance that pervades the universe and is causing its expansion to accelerate. Galaxies will cluster to different degrees and at different rates over cosmic time depending on how dark energy (and dark matter) change, so the galaxies provide signposts for the subtle behaviour of these unseen components in the universe.
That's a lot of galaxies to crunch, and just today a paper summarizing a full analysis of all six years of the Dark Energy Survey data has been submitted for publication (in the journal Physical Review D). The analysis deployed numerous statistical analyses to find out how galaxies clustered over the past six billion years, and how the light from distant galaxies is slightly distorted by the unseen dark matter around closer galaxies by dark matter. These results can then be compared to the standard model of cosmology, known as "Lambda Cold Dark Matter," or LCDM for short, which has a particular breakdown of the amounts of dark energy, dark matter, and regular matter in the universe, and an idea of how much pressure dark energy provides given its density (its equation of state). Notably, in the LCDM model, the behaviour of dark energy does not change over the billions of years for which the universe existed.
What do the DES data show? The analysis reveals...(drumroll)…that the universe can be explained quite well by the LCDM prescription, at least it behaves in a way that is statistically consistent with that model. Indeed, the analysis of all the DES data has halved the uncertainties of that statistical consistency. That said, the uncertainties still exist, and the data are consistent with a model where dark energy does change over cosmic time – even all those data are not enough to rule out either model. At stake is the prediction of how the universe will continue to evolve – will it accelerate endlessly or will the dark energy effect eventually weaken? Fortunately, new data will come that will help settle in the relatively near future, with other large-scale surveys like Rubin’s Legacy Survey of Space and Time and the Euclid survey all playing a part to get an even firmer grasp on how our universe is evolving. So, the DES results still remain interesting but we will have to be a little more patient to have more definitive conclusions. For more information, here’s a link to the story on phys.org and a link to the DES team’s arXiv preprint, which summarizes the output of 18 supporting papers.
To put this all in context, I can’t resist sharing one very nice image from the James Webb Space Telescope that was posted by the European Space Agency today as their Picture of the Month, a shot of the galaxy cluster MACS J1149.5+2223 that was obtained by the CANUCS survey led by our Chris Willott. The cluster is about 5 billion light years away and absolutely rife with galaxies. Indeed, a close perusal of the image will reveal the kinds of distortions the gravity from its normal and dark matter has imparted on galaxies far in the background of this cluster. These are examples of the kinds of clustering and distortions that DES measured for its cosmological study.
James Di Francesco, Director, Dominion Astrophysical Observatory